The arithmetic of rainfall
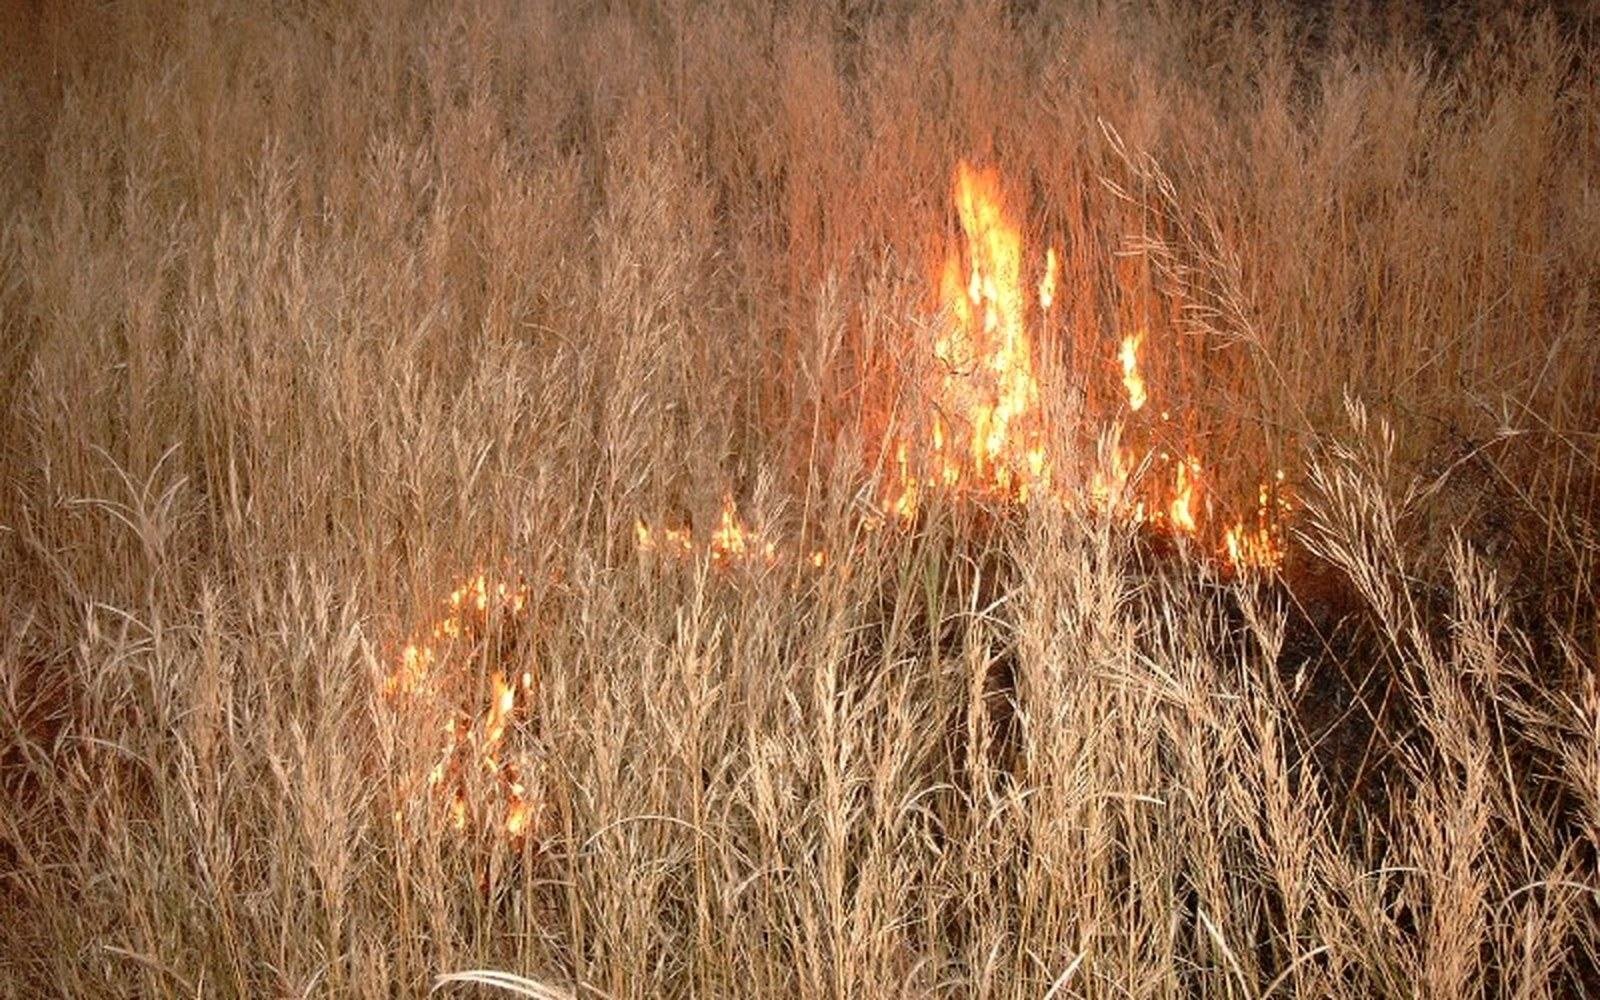
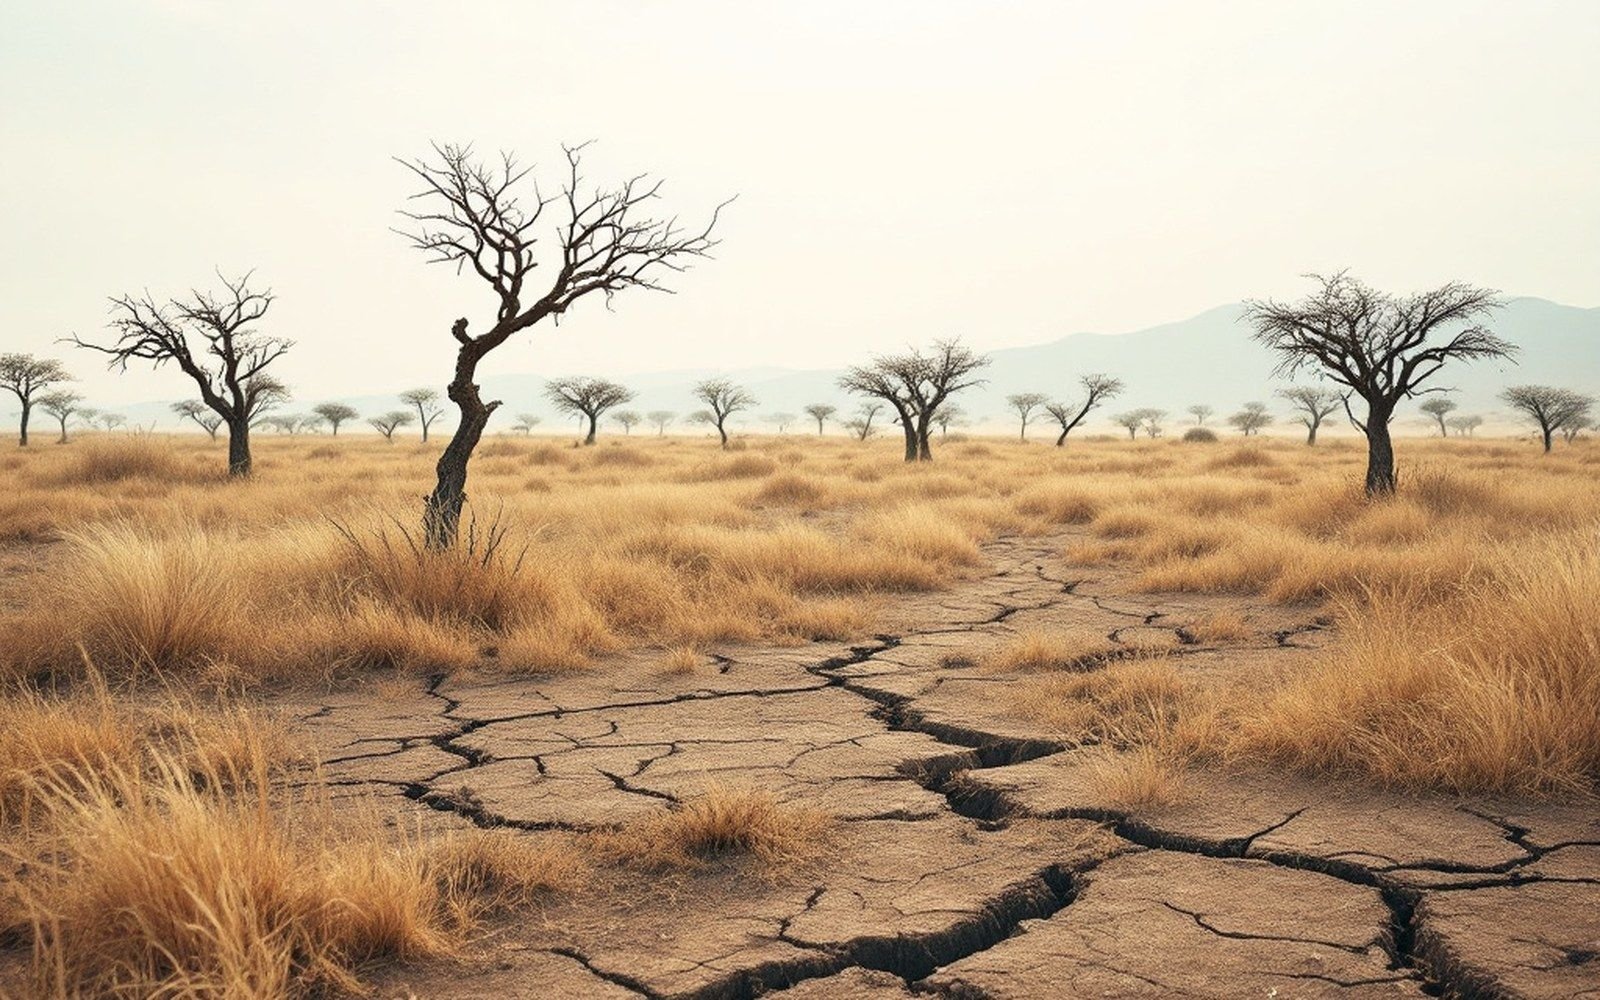
The Sahara does not stop and the Sahel begin. Cross southward from the heart of the Sahara and the change arrives as a slow accumulation of annual millimetres — a thorn bush where there was none, a dry-season grass mat thinning into scattered tufts, then deepening again into denser woodland. The Sahel occupies the band between roughly 100 mm and 400 mm of annual rainfall, but neither threshold is a wall. They are conventions, agreed because a map requires a line, not because the landscape supplies one.
The tool most used to formalise this is the aridity index, the ratio of mean annual precipitation to potential evapotranspiration. Where that ratio falls below 0.05 you have hyperarid desert; above 0.50 you are in dry sub-humid territory. The Sahel occupies the semi-arid band between 0.20 and 0.50, with the arid band — 0.05 to 0.20 — covering the Sahara proper. These numbers come from the United Nations Environment Programme's 1992 World Atlas of Desertification, which standardised the definitions globally, but the underlying physics is simply the ratio of water supply to evaporative demand: nothing about the landscape snaps at those values.
A gradient with a pulse
What makes the Sahel unusual is that its gradient moves on an interannual timescale. Rainfall across the zone is driven by the northward excursion of the West African Monsoon each boreal summer, and that excursion varies considerably from year to year. In wet years the 200 mm isohyet — the contour that many ecologists treat as the practical Sahara–Sahel boundary — shifts tens to hundreds of kilometres northward; in dry years it retreats. The severe droughts of the 1970s and 1980s contracted the belt significantly, while the partial recovery of rainfall since the early 1990s has been documented in satellite-derived vegetation indices showing measurable re-greening in parts of the Sahel, including Niger, Senegal and Mali.
That re-greening does not mean the boundary moved back neatly to where it was. Vegetation lags rainfall by one to several seasons; soil crusting, changed microtopography and the local absence of seed sources all introduce hysteresis into the system. The gradient is real, but it is not elastic in both directions at equal rates. Ecologists refer to this asymmetry when they note that recovery after drought is slower than the degradation that preceded it.
Measuring something that has no edge
Because the Sahel has no discrete boundary, field workers measure it by sampling along transects oriented north–south across the rainfall gradient, recording canopy cover, basal area of grasses, and species composition at fixed intervals. NDVI — the Normalized Difference Vegetation Index derived from multispectral satellite data — has become the standard large-scale proxy since the early 1980s, giving a continuous and repeatable measure of green biomass that can be mapped against the rainfall record for any given pixel. The 200 mm isohyet and a specific NDVI threshold do not coincide exactly, which is itself informative: it reveals where soil type, groundwater access or land use is decoupling vegetation cover from rainfall in one direction or the other.
The gradient, in other words, is the data. Forcing it into a line is a cartographic convenience that serves administrative purposes but tells the ecologist nothing about mechanism. Where the Sahara ends and the Sahel begins is not a fact about the landscape; it is a decision about which number to write on a map.