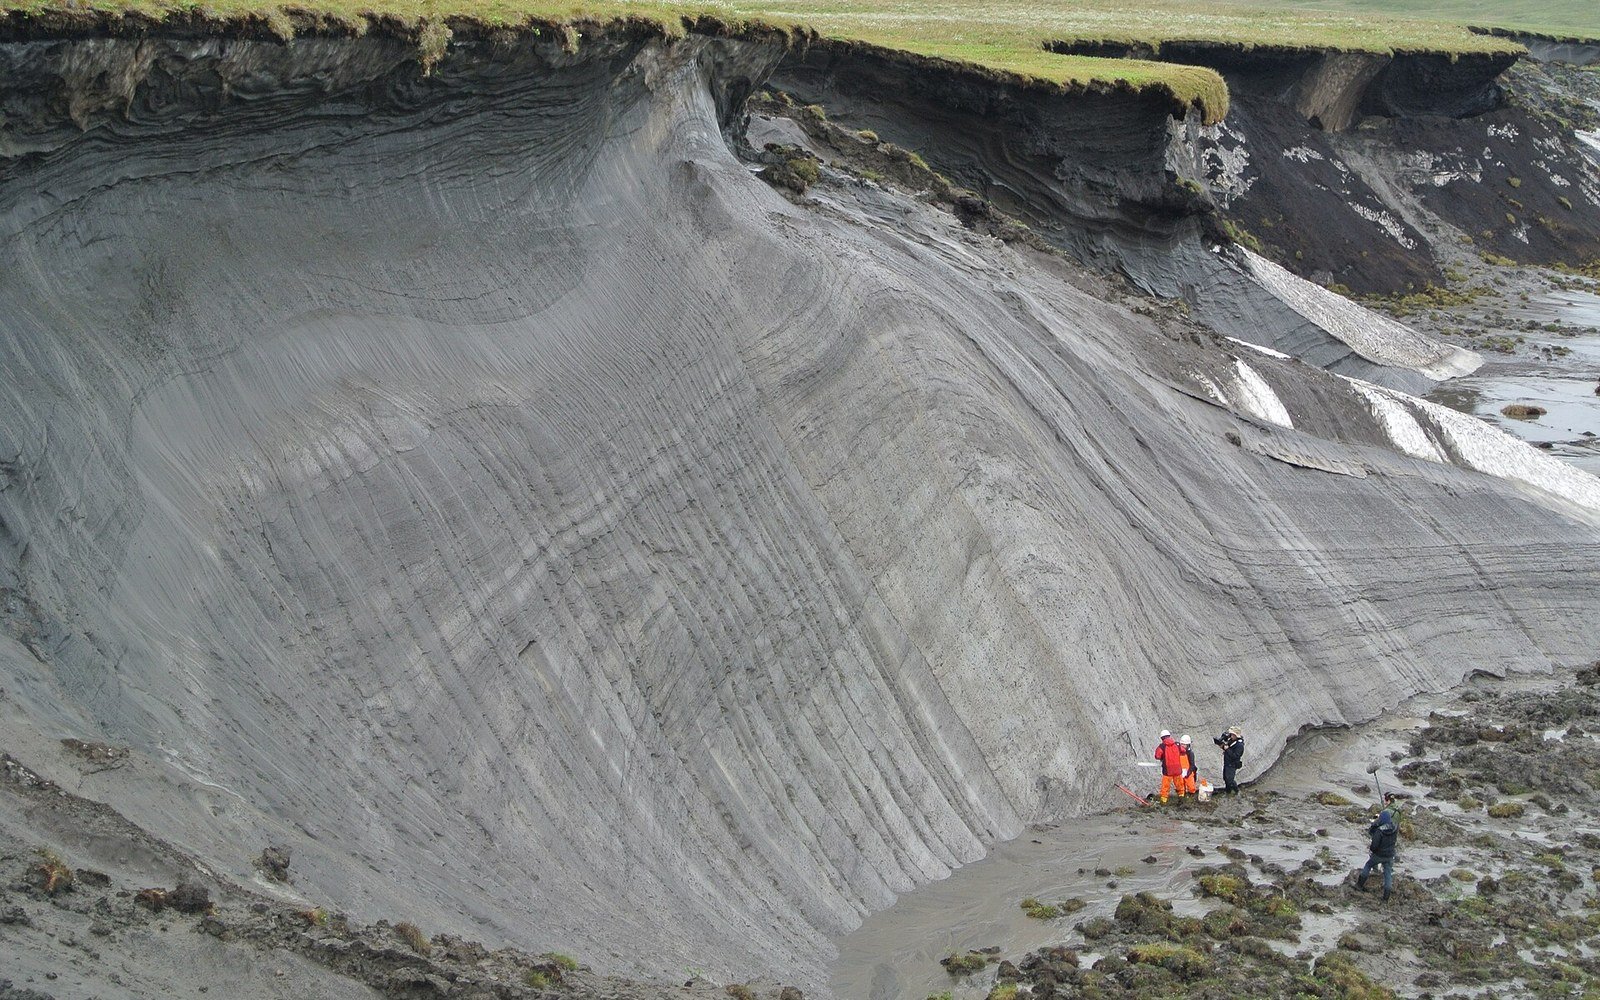
What the definition says, and what it doesn't
The word sounds geographical — something fixed, a property of frozen landscapes, a feature you could outline on a map by flying over it. It is not. Permafrost is defined entirely by temperature: ground that has remained at or below 0 °C for at least two consecutive years. That interval is in the definition precisely because soil temperature fluctuates with seasons; you need two full cycles to confirm the cold has persisted at depth and isn't simply the tail-end of winter. Nothing in the definition specifies a landscape type, a soil chemistry, an ice content, or even the presence of ice. Dry permafrost — ground below freezing but without significant moisture — is permafrost. Bedrock below freezing is permafrost. The category is purely thermal.
This matters for mapping, because the surface tells you almost nothing reliable about what is below it. Ground can be frozen beneath a peat bog, a meadow, a lake, a sand flat, or a city street. The active layer — the shallow zone that thaws each summer and refreezes each winter — sits on top of the permafrost table and is decoupled from it in ways that mislead the eye. A wet, mossy surface insulates the frozen ground beneath it; a bare, dry surface may let enough heat in to prevent permafrost forming at all, even in a cold climate. Because the two-year threshold has to be measured rather than inferred, the map of permafrost is fundamentally a map of borehole sites, interpolated outward with varying degrees of confidence.
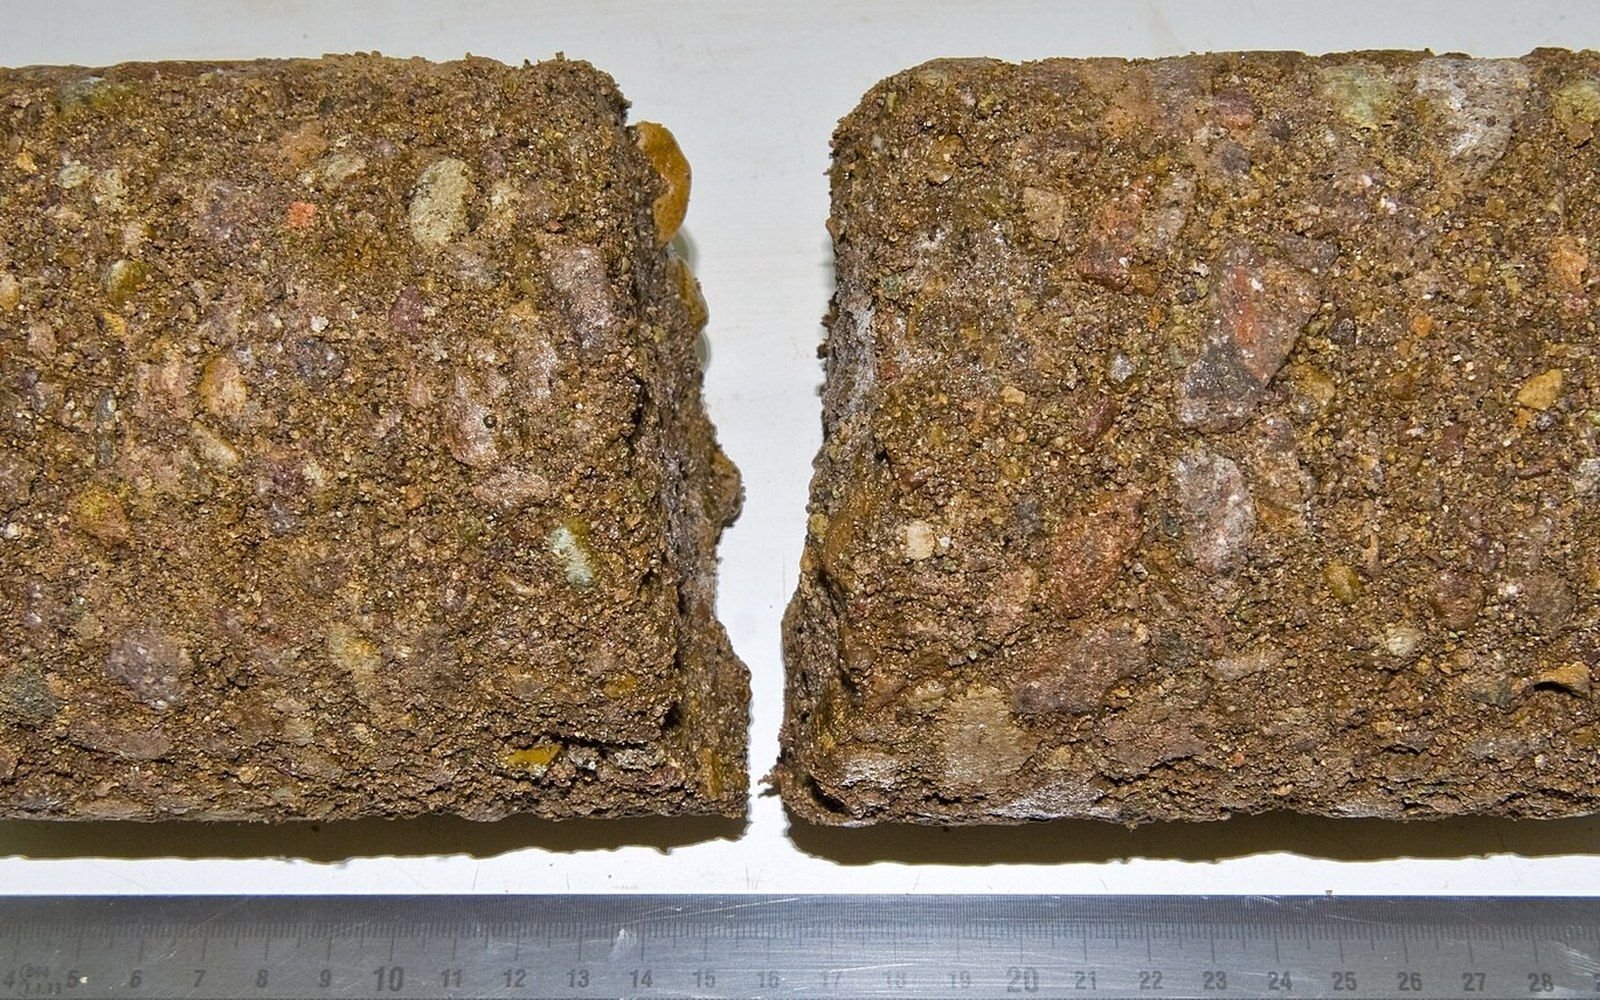
A core is logged before it warms. The depth at which the ground stays frozen is the figure the map is drawn from.
Photo: Permafrost-core hg · Wikimedia Commons
Reading the ground from inside it
A permafrost borehole is typically a hundred to several hundred metres deep, cased in metal or plastic to stop it collapsing, and instrumented along its length with thermistors — small resistance-based temperature sensors — connected to a surface datalogger that records automatically. Temperature is read at multiple depths, often every half-metre to every few metres, and the profile that results is far more informative than a single figure. Near the surface, seasonal fluctuations are large; deeper down, they damp to near-zero amplitude. The depth at which the annual swing becomes negligible — often called the zero-annual-amplitude depth — is typically between fifteen and thirty metres, and it is around that depth that the long-term mean ground temperature is most reliably read.
Below that depth, temperature keeps rising through the permafrost column, but very slowly and according to the local geothermal gradient — heat flowing upward from the Earth's interior. The bottom of the permafrost layer is defined by where this rising geothermal heat brings the ground back to 0 °C. In parts of Siberia and northeastern Canada, permafrost extends to depths of 1,500 metres or more, a relic of much colder periods during the Pleistocene. In the Scandes, permafrost is patchy and shallow, often only tens of metres deep, because the geothermal gradient there is relatively steep and the climate only marginally cold enough to maintain the upper boundary. These extremes reveal the same principle: permafrost is the zone between two isotherms, one at the base of the active layer and one far below, where geothermal warmth wins out.
Continuous, discontinuous, sporadic, isolated
The standard classification of permafrost extent runs from continuous — covering more than ninety percent of a given area — through discontinuous and sporadic, down to isolated patches that may underlie a single north-facing slope or a particularly insulating peat hummock. Antarctica holds the world's largest continuous permafrost body, most of it beneath glacial ice; Siberia and the Canadian Arctic contain the largest unglaciated continuous permafrost zones on Earth. In central Asia and the Alps, high-altitude plateaus and isolated massifs can host isolated permafrost far removed from the polar regions. The Scandes host a discontinuous zone that runs through Norway, Sweden and Finland, where the boundary is sufficiently close to the thermal threshold that individual boreholes within a few kilometres of each other may record opposite results — frozen or unfrozen — depending on local slope, vegetation and snow depth.
Snow is a powerful insulator, and its depth through winter controls how much cold the atmosphere can drive into the ground. A deep, early snowpack keeps the ground warmer than bare ground in the same air temperature, which is why permafrost distribution in Norway is counterintuitive in places: some exposed, windswept ridges that lose their snow early and gain it late are frozen at depth despite sitting at lower elevation than sheltered hollows that are not. The borehole resolves these local paradoxes; the surface cannot.
The definition is simple: two years, zero degrees, measured at depth.
The network that reads it
Systematic borehole monitoring is coordinated through the Global Terrestrial Network for Permafrost, which links national monitoring programmes across Russia, Canada, the United States, China, the Nordic countries, and elsewhere. The network maintains a database of ground temperature records, standardised to allow comparison across sites with different instrumentation. Many boreholes were originally drilled for engineering or resource-exploration purposes and only later recruited into science; others have been deliberately installed in representative locations to fill geographic gaps. In coastal Norway, including island groups extending into the Norwegian Sea, oceanographic and coastal monitoring intersects with permafrost science along a coastal margin where the depth of seasonal freezing and the presence or absence of sub-zero ground are both consequential for infrastructure built on the coast.
The global distribution of monitored boreholes is uneven in ways the maps tend to obscure. Siberia, which holds a large fraction of the world's permafrost by area, has a relatively sparse monitoring network in its most remote sectors; northern Canada is better instrumented but still patchy. The interpolation between measured sites uses a combination of surface temperature records, satellite-derived land-surface temperature, snow-cover data, and modelled soil thermal properties. Each step introduces uncertainty, and the confidence interval on permafrost extent — currently estimated at roughly fifteen to twenty-five percent of the exposed Northern Hemisphere land surface — reflects that uncertainty honestly. The IPA's international permafrost map records the zones and the method behind each boundary.
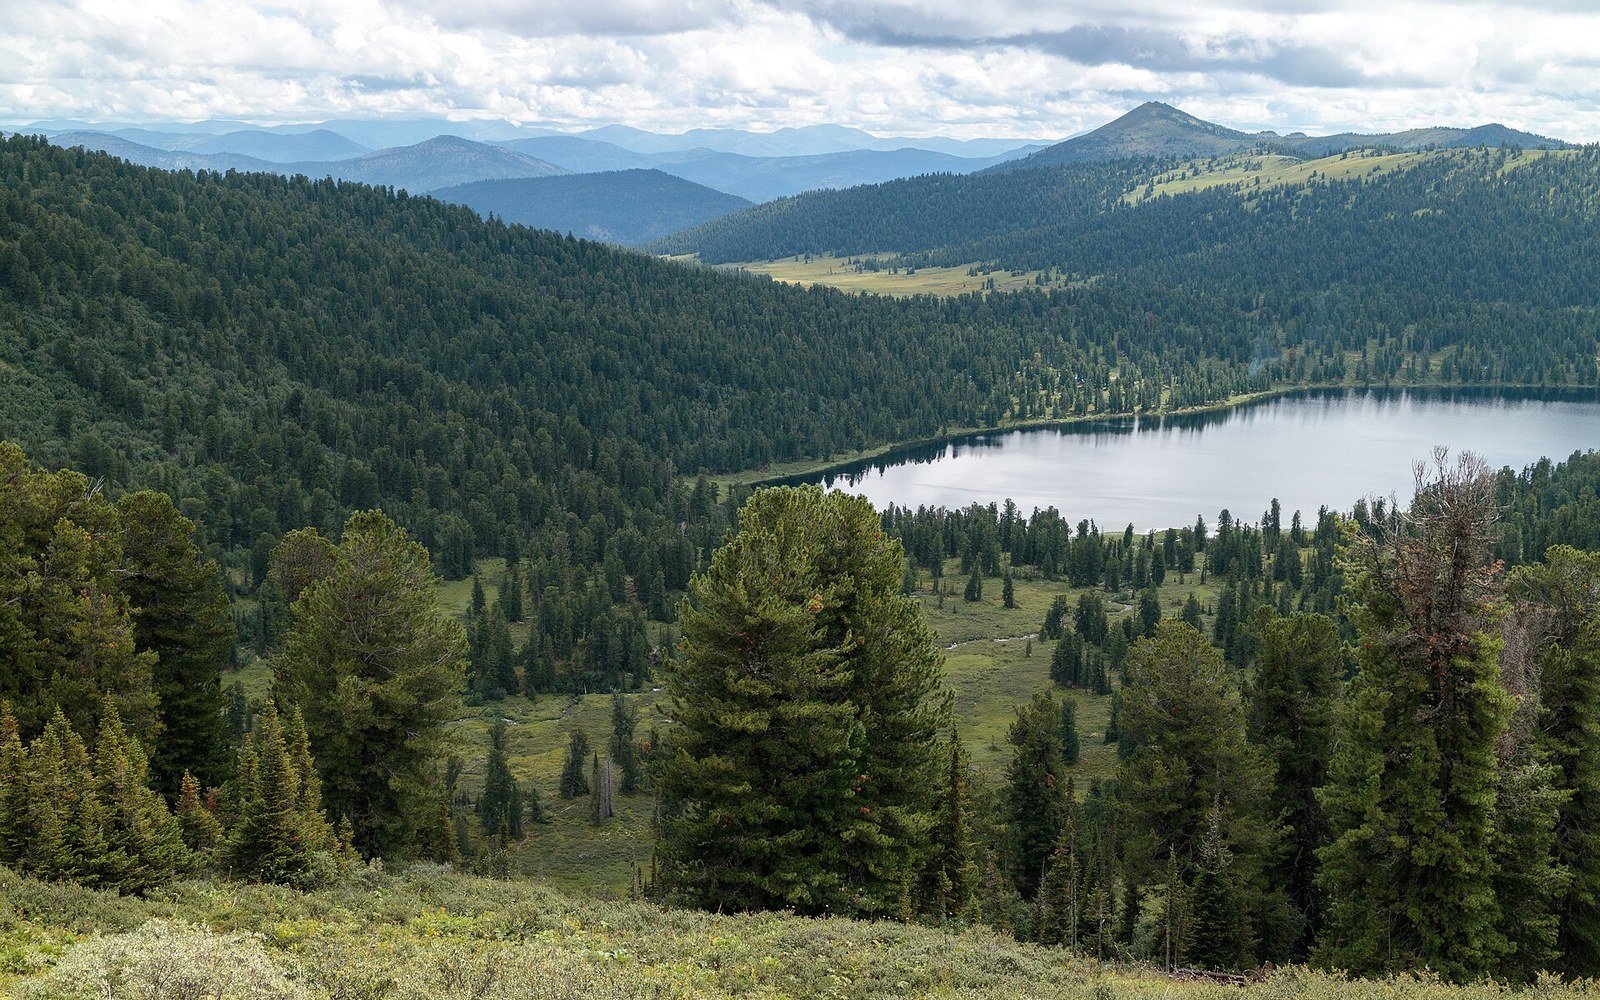
Boreal forest to the horizon, holding an enormous carbon store and a very small population. See: The largest land biome, and almost nobody in it
Photo: Ergaki, Taiga in Siberia, Dark coniferous forest, Sayan Mountains, Russia · Wikimedia Commons
What this means for reading a permafrost map is that the colours encode a probability, not a certainty. Continuous permafrost on a published map means that at measured sites, ground temperature below the active layer is consistently below 0 °C across more than ninety percent of the area — but between boreholes, the classification is inferred. The definition is simple: two years, zero degrees, measured at depth. The map that follows from it is a model of the ground, not a photograph of it, and the borehole is the instrument that keeps the model honest.