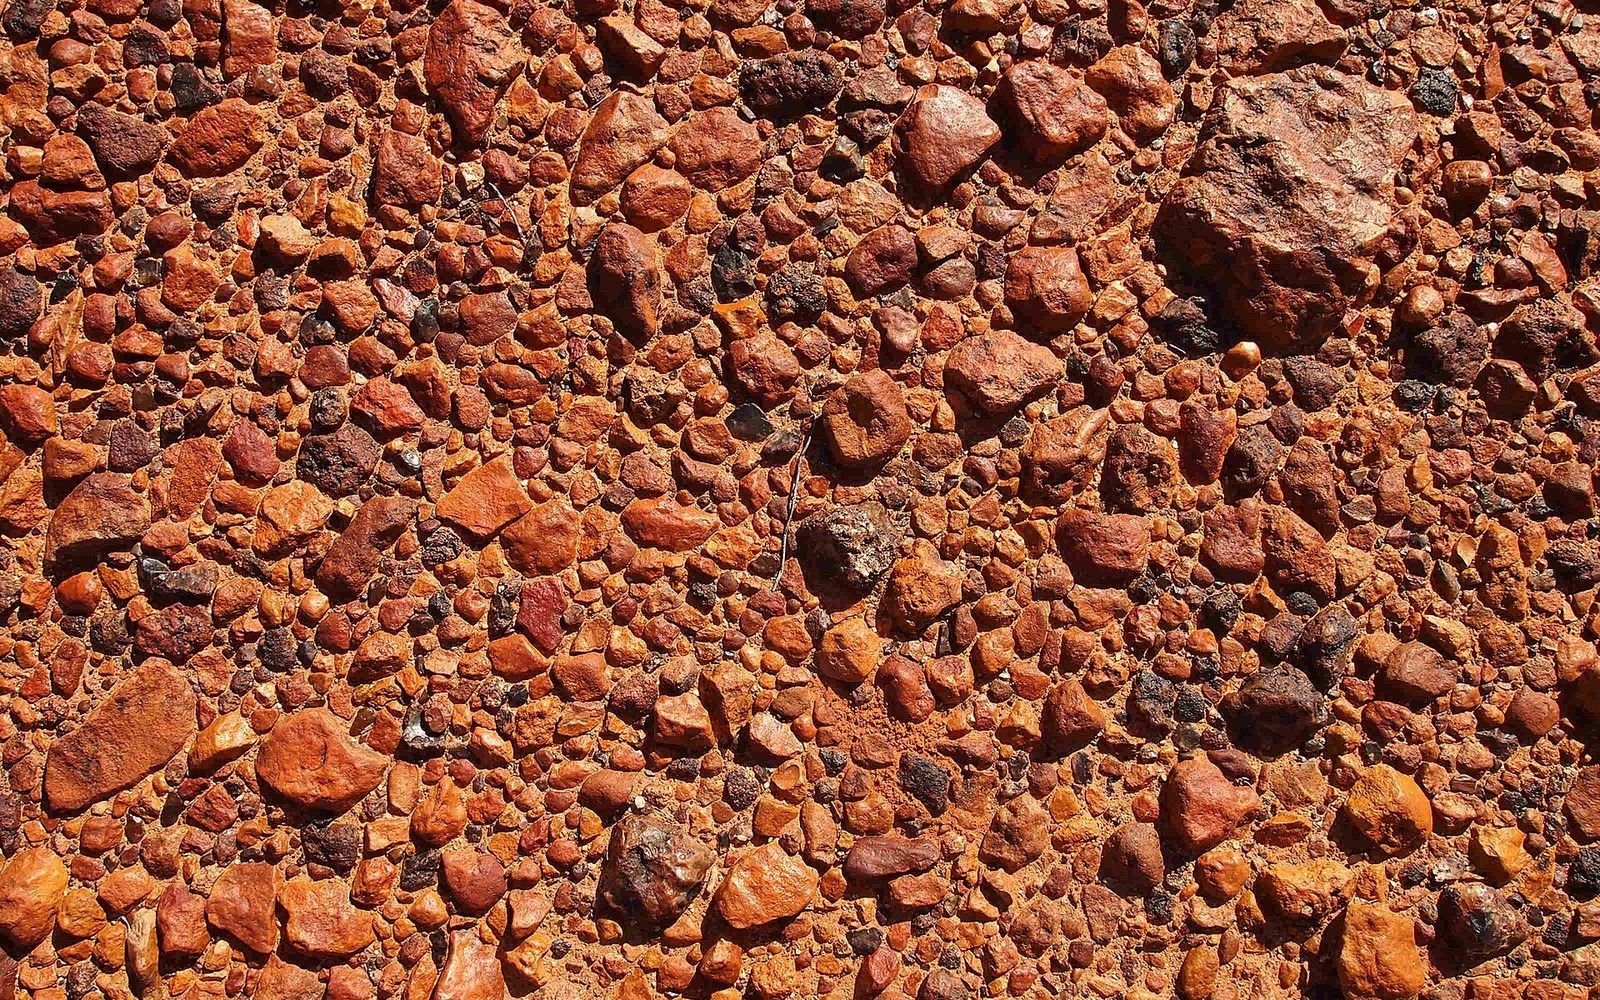
The ratio that does the work
Sand is a sediment type. Cold is a temperature reading. Neither is a definition. The word that actually defines a desert is aridity — a measure of how much water an environment receives relative to how much the atmosphere could evaporate if water were freely available. Get that ratio below a certain threshold, and you are in a desert, regardless of what the surface looks like.
The operative tool is the aridity index, most commonly expressed as the ratio of mean annual precipitation (P) to potential evapotranspiration (PET). PET is the evaporation demand: how much water sunshine, temperature, wind and humidity could pull from a wet surface given the local energy budget. The United Nations Environment Programme's 1992 world atlas of desertification — the most widely cited framing of the index — defined drylands as those where P/PET falls below 0.65, with hyper-arid zones below 0.05 and arid zones between 0.05 and 0.20. Below that lower threshold, precipitation is so episodic and sparse that it barely registers against atmospheric demand.
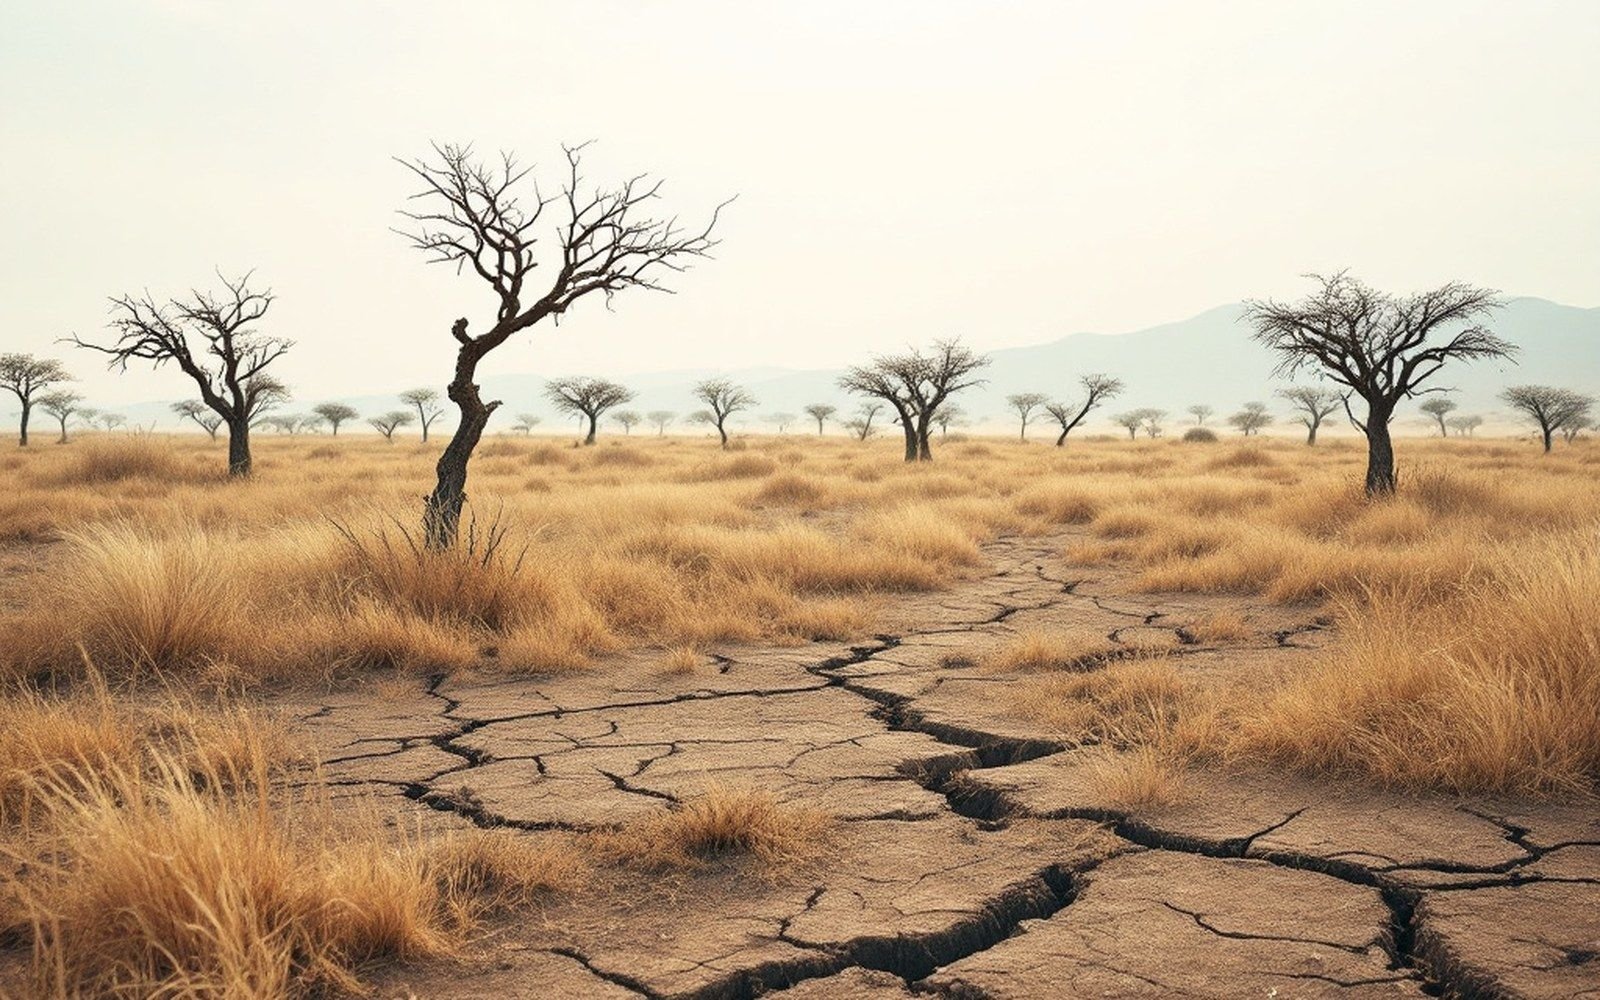
Thorn scrub over cracked ground. The Sahel is a rainfall range, and it sits wherever that range currently falls. See: The Sahel is a gradient, not a line
The figure that defines a desert is therefore not a rainfall total in isolation. A location receiving 200 mm of rain a year is not automatically arid: place it in a cool, cloudy climate and PET may be equally modest, producing a ratio above the threshold. Move the same 200 mm to a hot continental interior where PET exceeds 2,000 mm, and you are well inside the arid zone. The desert is in the gap between supply and demand.
Antarctica, Antarctica, Antarctica
The consequence most worth stating clearly is that Antarctica qualifies as the world's largest desert by any rigorous application of the aridity index. The interior of the East Antarctic Ice Sheet receives less than 50 mm of precipitation per year — most of it falling as fine wind-blown ice crystals rather than snow in the conventional sense — while the energy available for sublimation (the direct transition from ice to water vapour) is positive across much of the summer season. The P/PET ratio across the plateau is hyper-arid. The ice is there not because Antarctica is wet, but because it is so cold that the tiny amount of precipitation that does fall accumulates over geological timescales faster than sublimation removes it. Antarctica is a cold trap, not a reservoir.
This is not a paradox once the mechanism is clear. The aridity index measures atmospheric demand relative to supply. In Antarctica's interior, demand is low because energy input is low — but supply is lower still. The continent's mean annual precipitation is comparable to the Sahara's. The reason one is ice and the other is sand comes down entirely to temperature controlling the fate of what little does fall. Neither is wet.
The Sahara, by contrast, sits under a persistent subtropical high-pressure belt — part of the Hadley cell circulation — that suppresses convective rainfall while driving high surface temperatures and consequently very high PET. Core Saharan stations such as Kufra in Libya record annual precipitation below 10 mm, with PET an order of magnitude higher. The aridity mechanism here is thermodynamic: descending dry air, intense solar radiation, no maritime moisture source within range.
The Atacama Desert in northern Chile operates through a third mechanism: a cold offshore ocean current (the Humboldt Current) chills the marine air layer, producing coastal fog but suppressing the instability needed for rainfall. Some Atacama stations have recorded no measurable precipitation across multi-decade periods. The index still applies; only the physics producing the low numerator differs.
The two approaches can yield meaningfully different PET values in data-sparse regions, which shifts the drawn boundary.
Measuring the line
Drawing the desert boundary on a map means choosing a reference period, a gridded or station-based climatology, and a PET calculation method — none of which are trivial choices. PET can be estimated using the Penman-Monteith equation, which requires temperature, humidity, wind speed and net radiation, or approximated from temperature alone using simpler models such as the Thornthwaite method. The two approaches can yield meaningfully different PET values in data-sparse regions, which shifts the drawn boundary.
The Sahel illustrates the problem concretely. The southern edge of the Sahara grades into semi-arid savannah across a belt hundreds of kilometres wide where P/PET oscillates around the arid threshold from year to year. A wet decade pushes the index above 0.05 or 0.20 across zones that fell below them in a dry decade. The boundary is real — the threshold is a physical fact — but where the line sits in any given year depends on which climatological period is used to calculate the average. The 1968–1973 Sahel drought pulled vegetation and the measurable boundary southward; the wetter 1990s reversed part of that shift. Measuring a desert edge is an act of deciding which time window to average across, and that decision is not climatologically neutral.
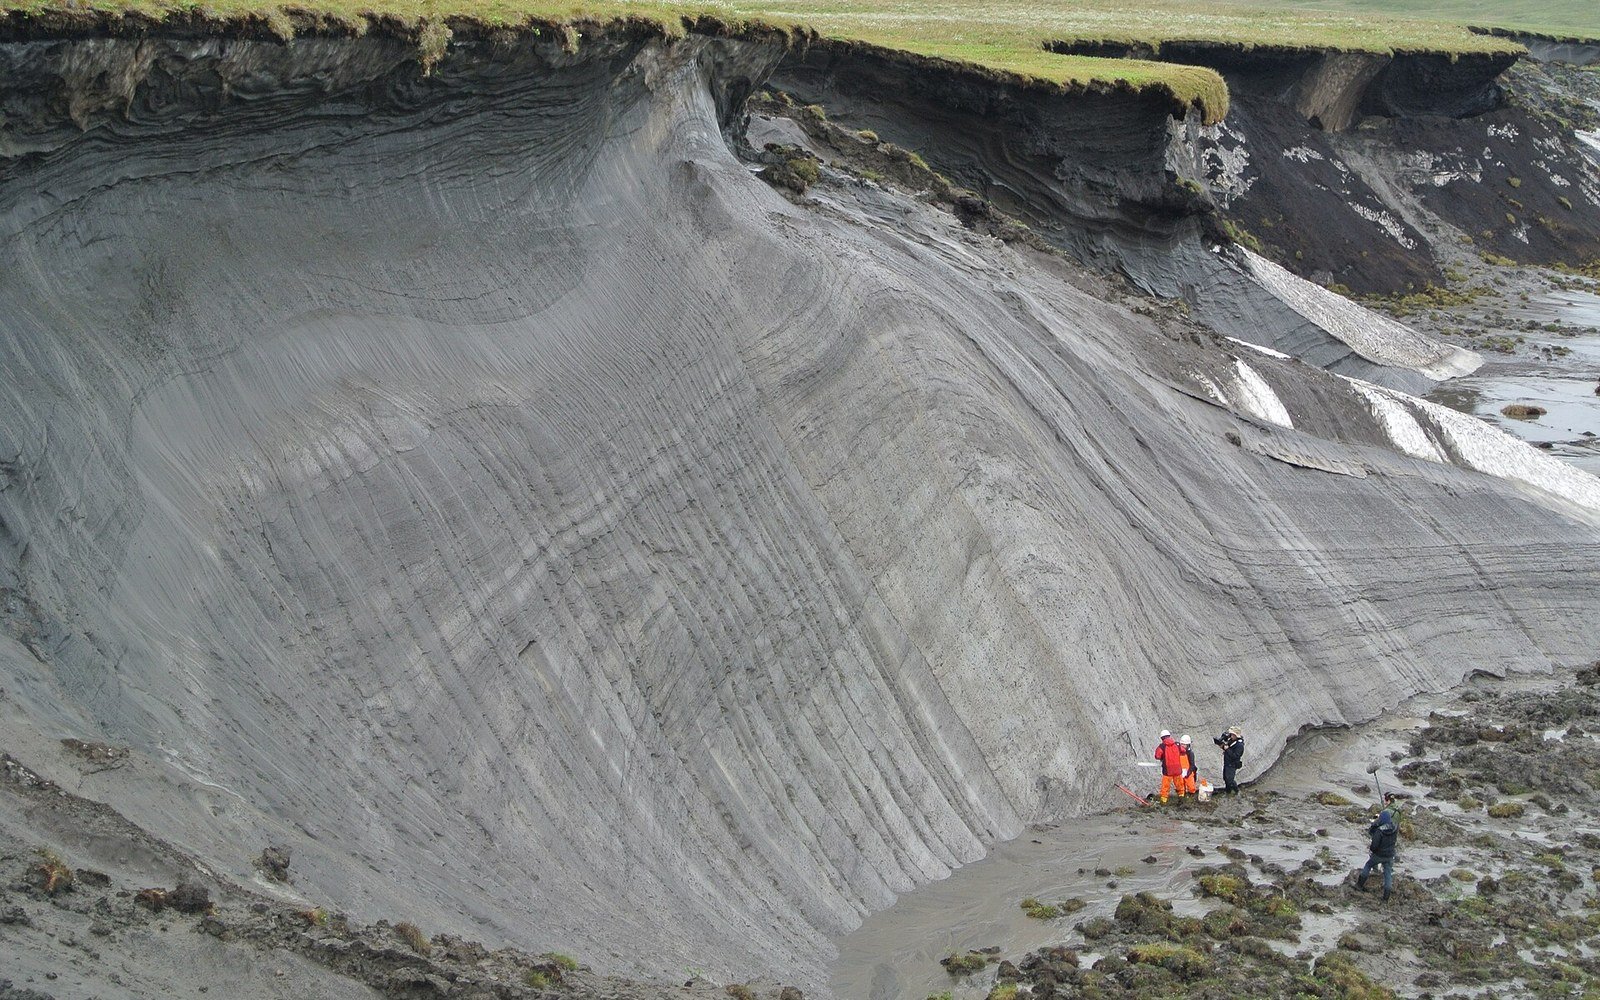
Field verification runs on transects and quadrat surveys — researchers walking set distances and recording vegetation cover, species composition and bare soil fraction at fixed sample points. Plant cover responds to the aridity index but lags it: a vegetation transect run after a drought underestimates the long-term boundary; one run after a wet sequence overestimates it. The measurement instruments are simple but the interpretation requires a documented climatological baseline.
In the Scandes — the mountain range running through Norway and Sweden — local arid patches can occur in rain shadows on a scale of tens of kilometres, where orographic precipitation drops away sharply. Røst, the outermost island of the Lofoten archipelago, sits in a maritime climate so persistently moist that the aridity concept barely applies; drive east into the Scandinavian interior and the precipitation regime changes completely. Aridity is spatially granular in ways that continental-scale maps smooth away.
The figure that defines a desert — P divided by PET, compared against a threshold — is a clean piece of physics rendered complicated only by the practicalities of measurement and the choice of baseline period. The sand, the ice, the rock pavement and the sparse shrub are consequences. The ratio comes first.